Dashboards
Your data was always this clear. You just could not see it yet.
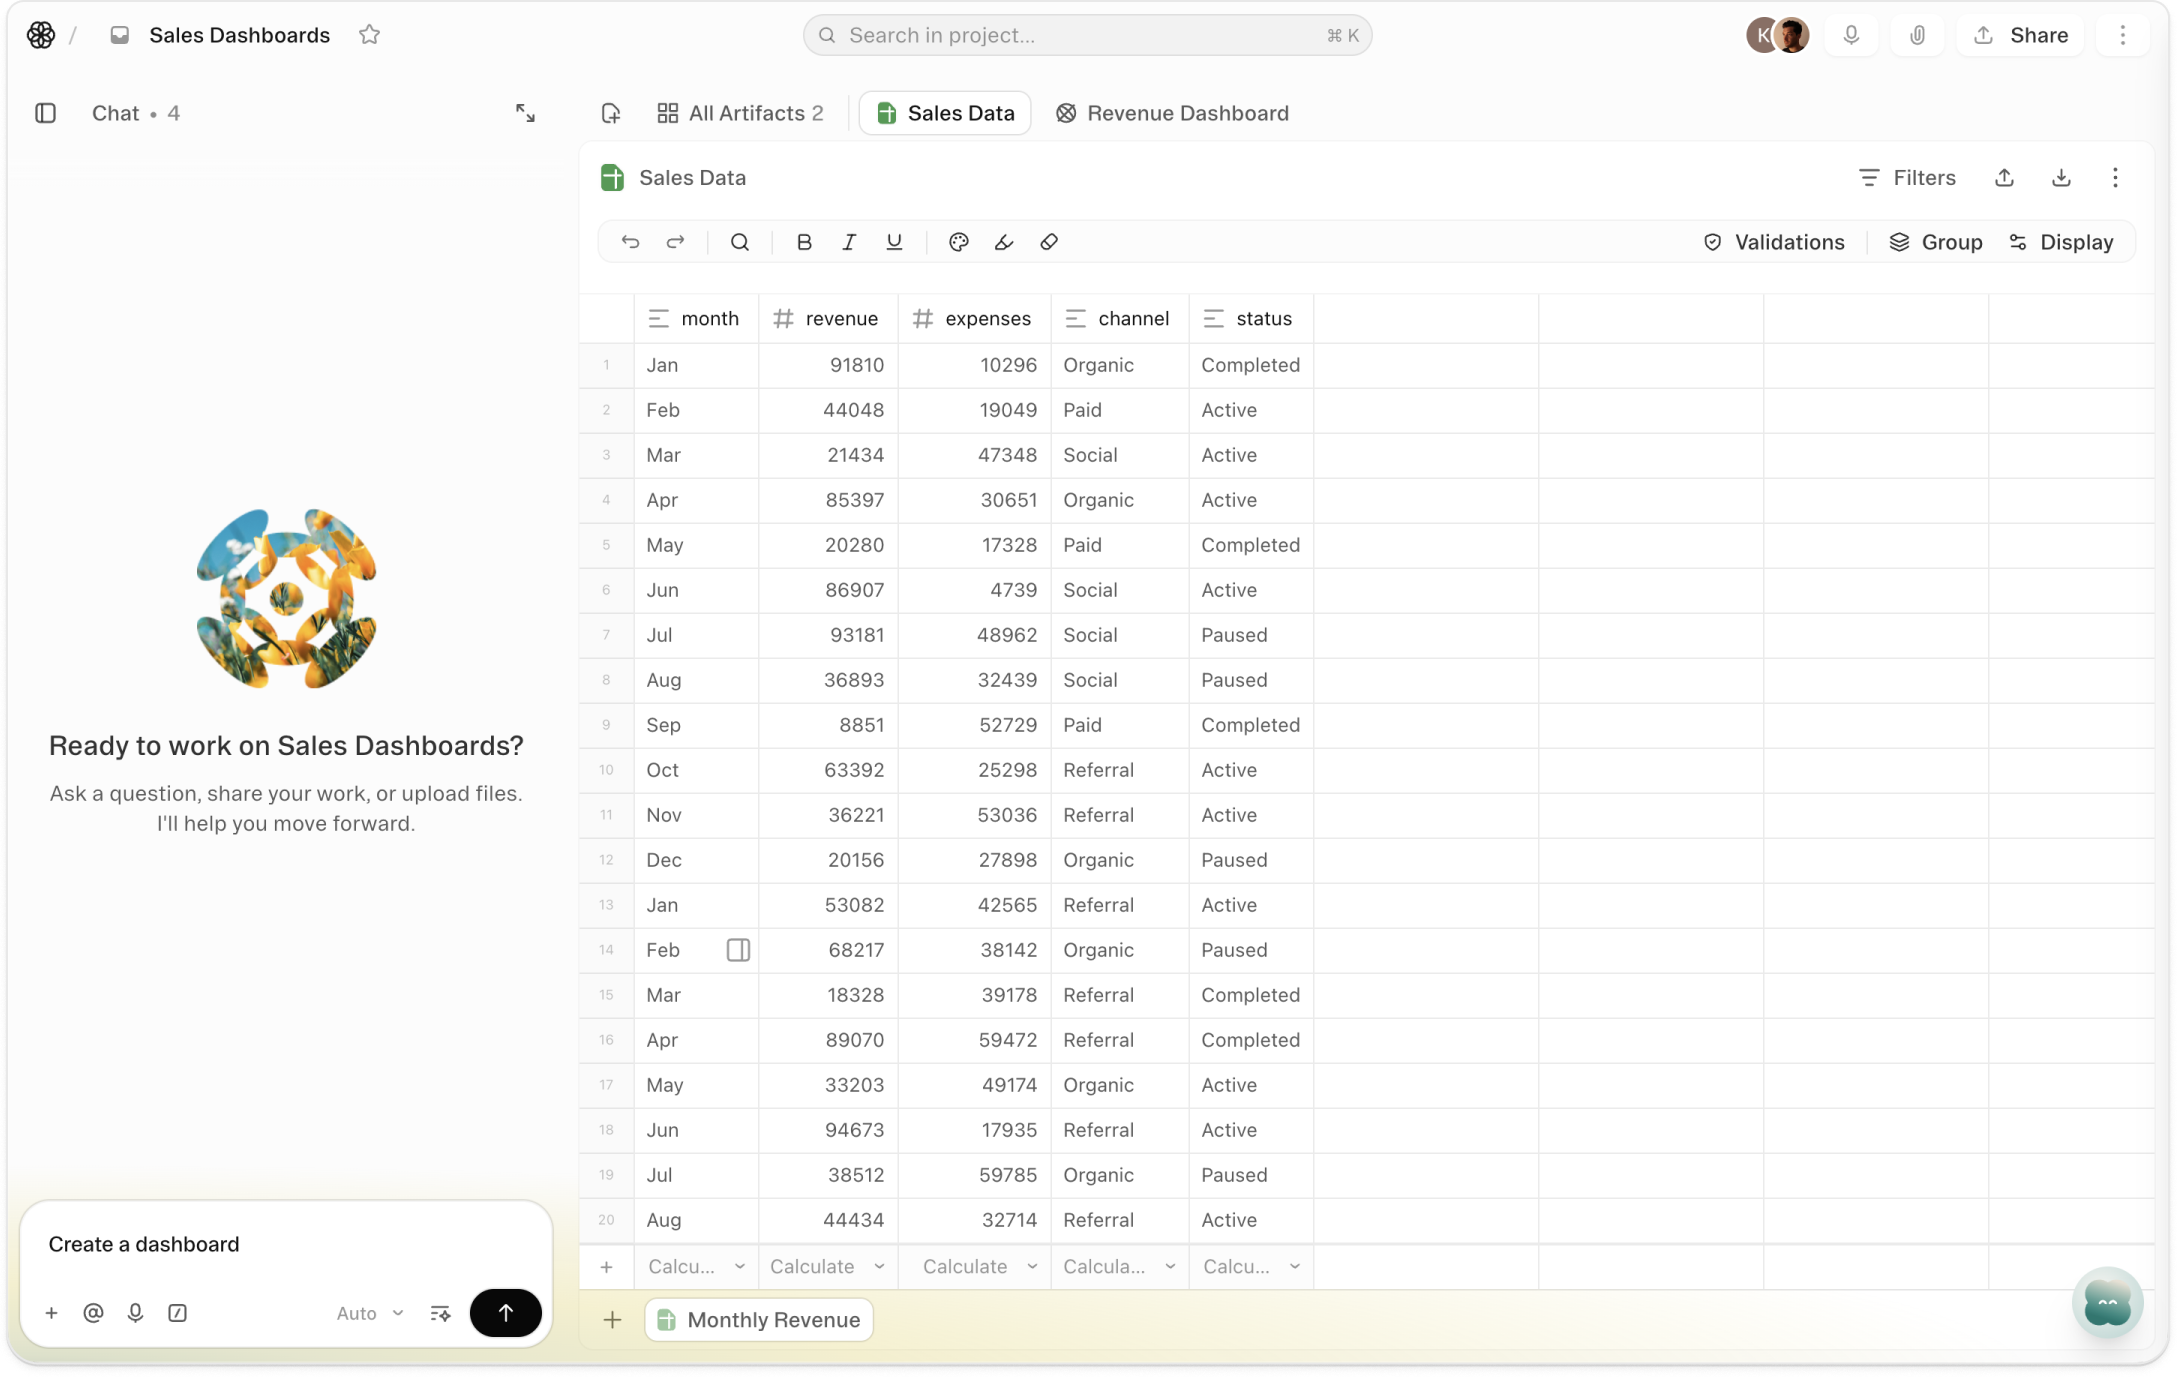
Live charts, built from your sheets.
About Dashboards
Ask the agent to build a dashboard. Name the sheet, name the metrics, describe the layout. It builds it — bar, line, pie, area, donut, scatter, radar. Charts appear in rows, text blocks alongside them, everything arranged side by side at whatever width you choose. The agent does the configuration. You get the picture.
Every chart connects directly to a sheet. Edit a row. Import new data. Close a deal. The chart reflects it immediately — no refresh, no export, no rebuild. The dashboard is not a snapshot of your data. It is your data, rendered differently.
A sheet with 200 rows tells you everything and shows you nothing. A dashboard does not change the data — it changes what the data can communicate. Put it where people can see it before the meeting, not after.
Videos
Templates
Start with a template that uses this feature


Shortcuts
One-click prompts to try this feature
Pipeline by Stage
See where every deal sits, by stage and by rep, without opening the sheet.
Weekly KPI View
Turn my metrics sheet into a chart that updates when the numbers do.
Project Progress Summary
Show what is done, what is stuck, and who is carrying it — no meeting prep required.
FAQ
Get help with Dashboards
Find guides, tutorials, and support articles in our help center.
Visit help center →